Sales call performance metrics tell you whether your outbound calling is working, but only if you track the right ones and calculate them the same way every week. Many teams track either too little (total calls and nothing else) or too much (a dashboard of twenty numbers nobody reads). Both leave managers guessing about what to change.
This guide sets out nine metrics that cover an outbound call from first dial to booked appointment, with a plain formula for each, what it tells you and the common ways it gets misread. It finishes with a worked example and a one-page scorecard you can copy. The definitions match what you will find in most dialler reports, including Veyce's, so you can apply them whichever tool you use.
What sales call performance metrics are for
A metric is only useful if it points at a decision. Before adding a number to your report, ask what you would do differently if it went up or down. In the language of key performance indicators, you want a small set that links effort to results.
Activity, reach, conversion and quality
The nine metrics fall into four groups. Activity metrics show how much calling happened. Reach metrics show how often calls found a real person, and the right person. Conversion metrics show how often conversations turned into outcomes. Quality metrics hint at what happened inside the calls. A healthy report has at least one number from each group.
Leading and lagging numbers
Appointments are a lagging number: by the time they drop, the cause happened days ago. Calls made and connect rate are leading numbers: they move first. Watching both lets you catch a problem (a stale list, a missed calling block) before it shows up in bookings.
Numbers you can safely skip
Some popular numbers add noise rather than insight for a small outbound team. Dials per hour looks precise but mostly measures how fast a rep clicks; total calls in a protected block tells you the same thing with less fuss. Average time between calls matters for manual dialling but much less once a power dialler handles the next number. Lifetime totals per rep are motivating on an achievements page but unhelpful in a weekly review, because they reward tenure rather than recent performance. Revenue per call is worth knowing at the business level, yet it depends on deal sizes and sales cycles that sit well outside the calling session. Leave these out of the weekly report unless a specific question needs one of them, and add them back only for as long as that question is open.
The nine sales call performance metrics
Each metric below has a definition and a formula. Use the same period (today, this week, this month) for every metric in a comparison.
Activity: calls made, sessions and total talk time
- Calls made: every outbound dial, answered or not. It measures effort, not results.
- Sessions: the number of calling blocks a rep ran. Fewer sessions with the same call count can mean longer, better-protected blocks.
- Total talk time: the combined duration of connected calls. It shows how much real conversation happened, which raw call counts hide.
Reach: connect rate and owner reached
- Connect rate = connected calls / calls made. A falling connect rate usually points to the list or the time of day, not the rep.
- Owner reached (or decision maker reached): the number of conversations with the person who can say yes. Gatekeeper conversations count as connected but not as owner reached. The gap between the two is a useful number for B2B teams.
Conversion: pitch complete, booking rate and appointments
- Pitch complete: conversations where the rep delivered the full pitch rather than being cut off in the opener. Pitch complete / owner reached shows how well the opener earns time.
- Booking rate = appointments / connected calls. This is the core conversion number.
- Appointments (bookings): the outcome most teams are paid on. Track it as a count and as a rate.
Quality: average call length and outcome mix
- Average call length = total talk time / connected calls. Very short averages can mean early hang-ups; very long ones can mean reps struggle to close the call.
- Outcome mix: the share of calls ending in each outcome (Booked, Follow Up, Call Again, Objection, Gate Keeper, Not Interested, Not Qualified, Bad Number). A rising Bad Number share means list quality is slipping; a rising Objection share is worth a script review.
Veyce: where these metrics live
Veyce is a power dialler for Australian sales teams, and every metric above appears somewhere in the app without manual tallying.
Live Call Metrics on the calling screen
While a rep is calling, the dialler shows Live Call Metrics for today: calls made, answer rate, call duration for the session and appointments. Reps tap counters for Owner Reached, Pitch Complete and Appointment Set as calls happen, which is how the reach and conversion numbers above get captured.
The Reports page
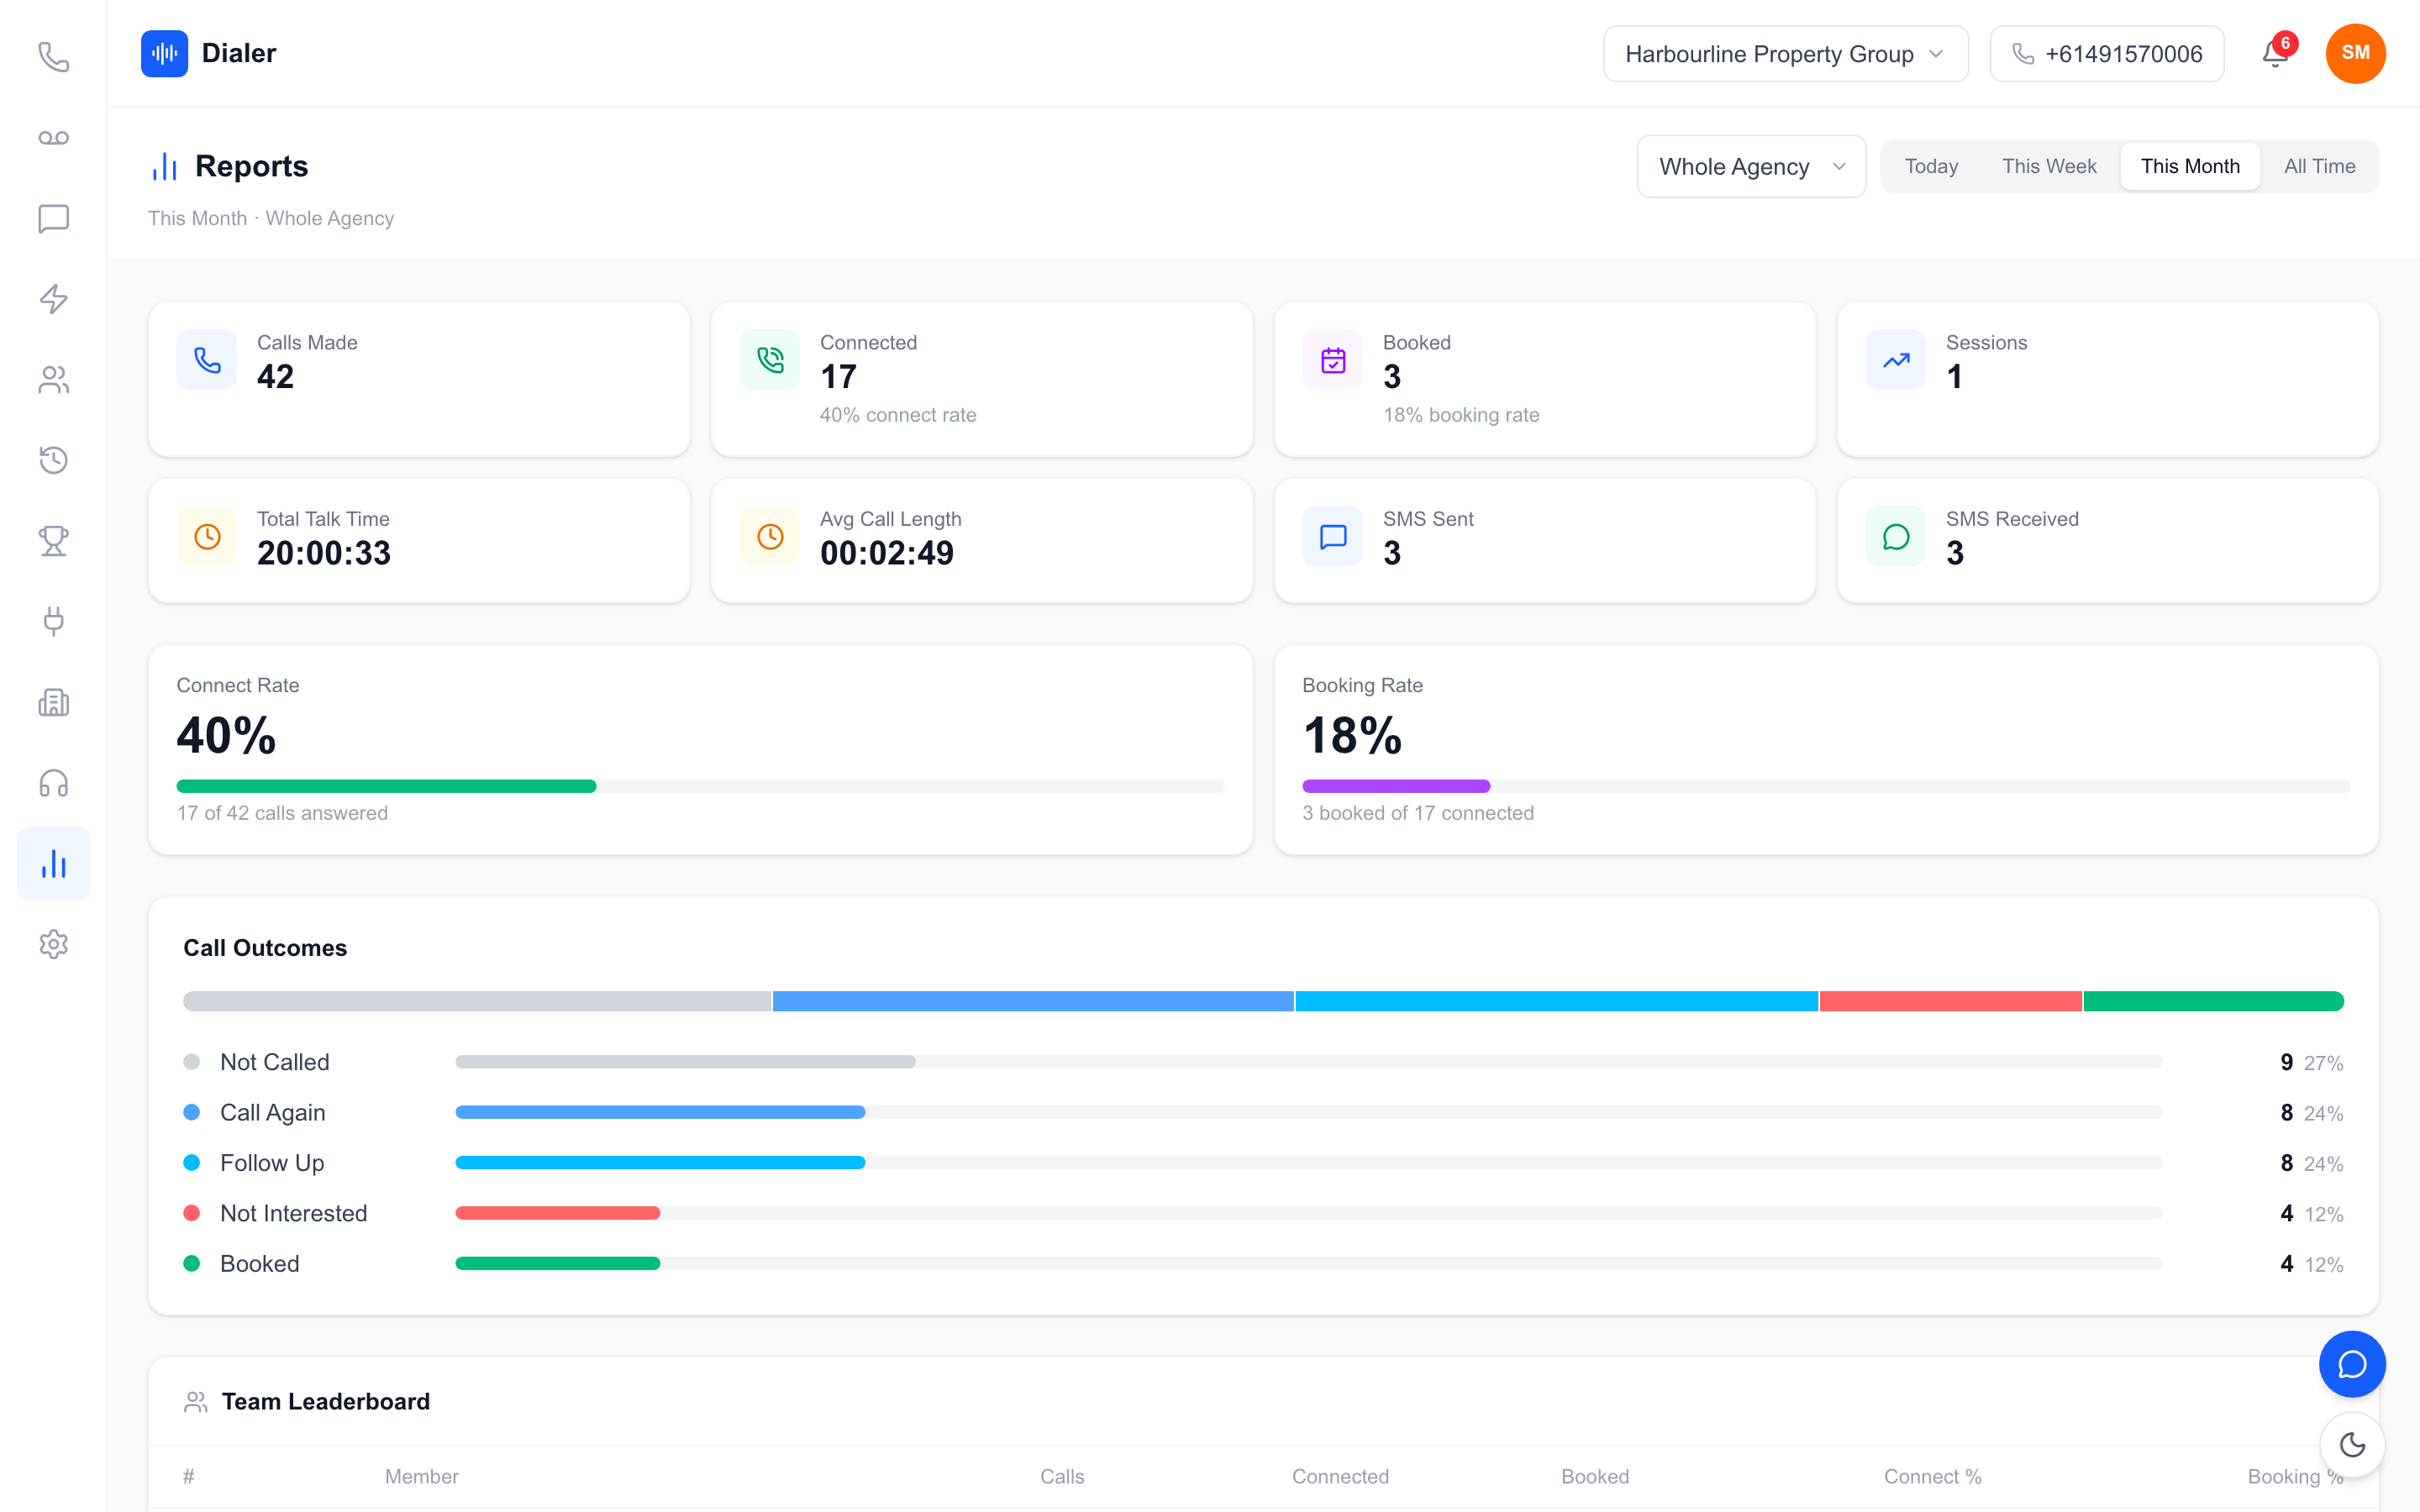
Reports shows calls made, connected calls and connect rate, bookings and booking rate, sessions, total talk time, average call length, and SMS sent and received, for today, this week, this month or all time. A call outcomes chart shows the outcome mix, and a team leaderboard lists calls, connected, booked, connect percentage and booking percentage for each rep. Choose Whole Agency or a single member.
Session History
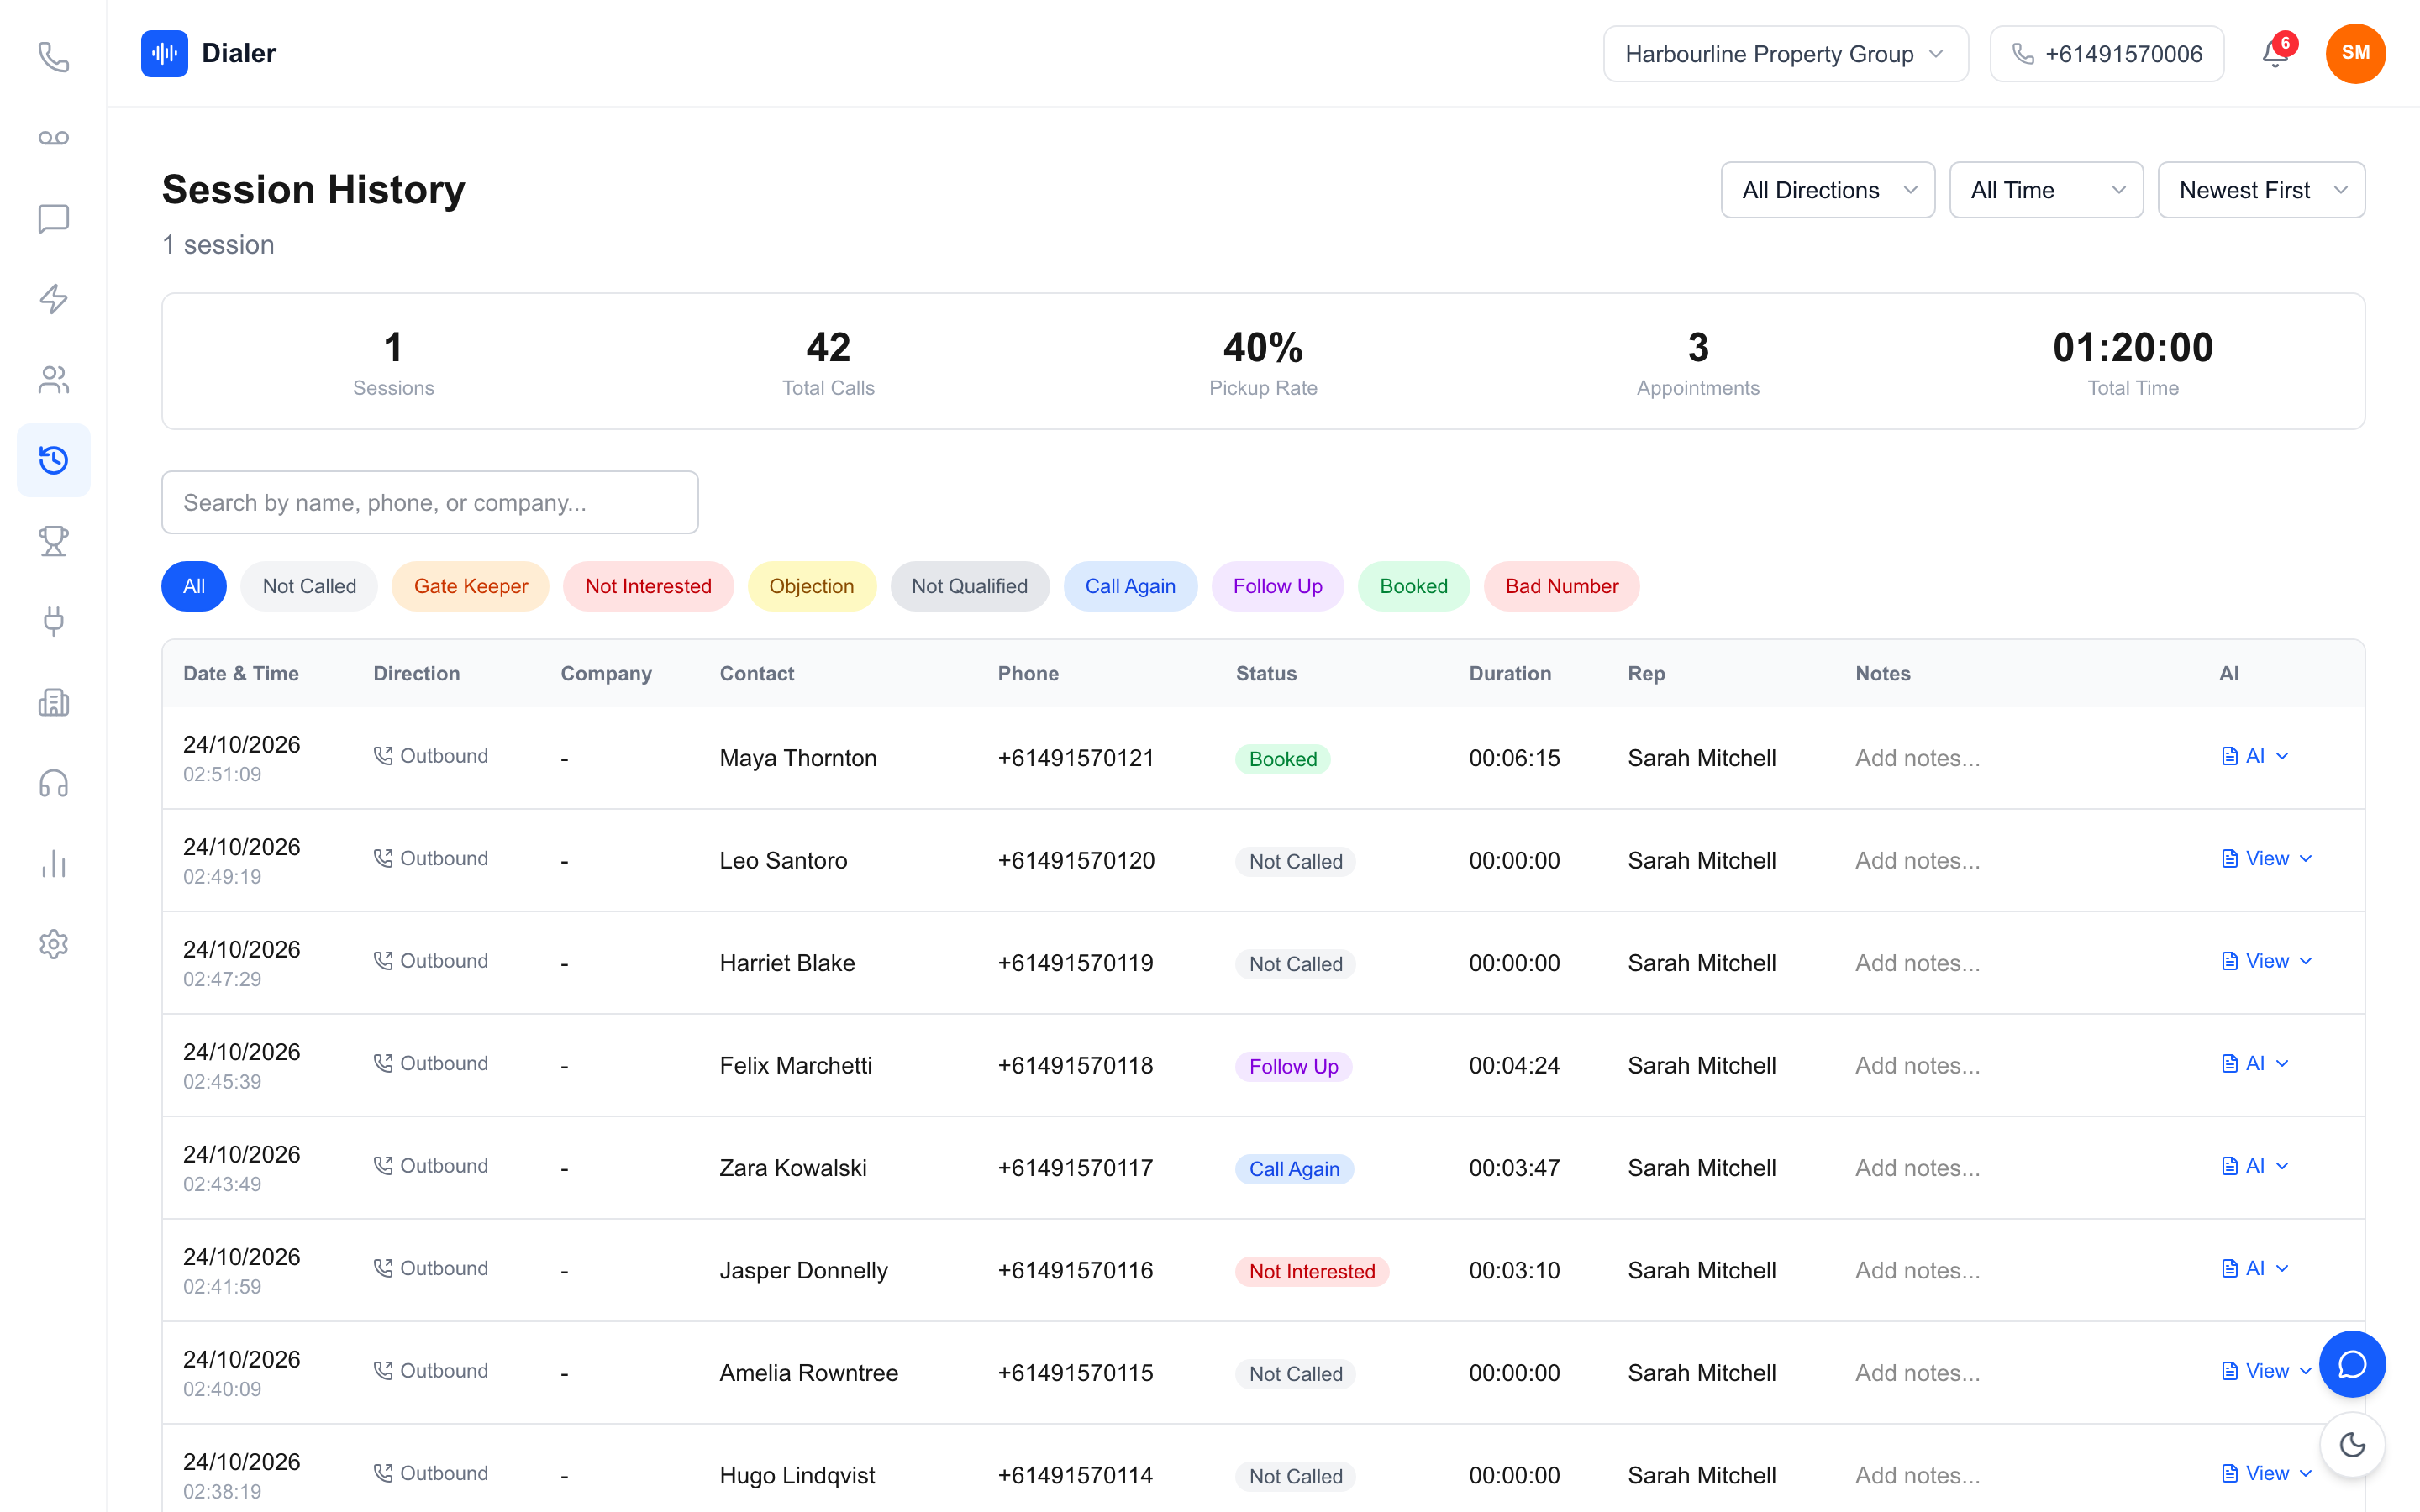
Session History lists every session with summary totals for the range you choose: sessions, total calls, pickup rate, appointments and total time. You can filter calls by outcome and open any recorded call to read its transcript and AI summary, which are produced after the call ends.
Reading the metrics together
No single metric tells the story. The value comes from reading them as a chain.
A worked example funnel
These figures are a worked example with stated assumptions, not Veyce data or a benchmark. Assume one rep in one week makes 300 calls. 75 connect (a 25% connect rate). Of those, 45 reach the owner, 30 hear the full pitch and 6 book (an 8% booking rate on connected calls). Reading down the chain: reach is fine, but only two-thirds of owner conversations get to the full pitch (30 / 45). The opener is the place to work, not the call count. Doubling calls would double bookings only if every rate held, which is rarely true when a rep starts rushing.
Common misreads
- Comparing booking rates between reps working different lists. A rep on aged leads will trail a rep on fresh referrals regardless of skill.
- Treating a low connect rate as laziness. Check the list source and calling times first.
- Reading one day. Use weekly figures for decisions; daily figures are for the rep during the block.
Build a one-page scorecard
Pick one metric from each group for each rep, weekly: calls made, connect rate, booking rate and outcome mix. Add appointments as the headline. Write last week's figure next to this week's. That is enough to run a useful one-on-one, and it fits on a screen. Keep a short note beside any number that moved sharply, such as a new list source, a public holiday or a script change, so the context survives when you look back a month later. Over a quarter, those notes become the most useful part of the scorecard, because they show which changes actually moved the numbers and which only felt like they did. If you are still choosing a tool that reports these numbers, our overview of sales dialler software in Australia covers what outbound teams need.
Conclusion: fewer numbers, read together
The best sales call performance metrics are the ones you can calculate the same way every week and act on: calls made, connect rate, owner reached, pitch complete, booking rate, appointments, talk time, average call length and outcome mix. Read them as a chain from dial to booking, and fix the weakest link before asking for more calls.
To see these numbers on your own calls, the Veyce power dialler for Australian teams captures them as reps dial. Plans are listed on the Veyce pricing page, and Veyce's free trial gives you 3 days from your first call and 100 calling minutes with no card.
Frequently asked questions
What are the most important sales call performance metrics?
For most outbound teams the essentials are calls made, connect rate, booking rate and appointments, plus the outcome mix that shows why calls ended the way they did. Teams selling to businesses should add owner reached, because gatekeeper conversations inflate connect rate. Total talk time and average call length round it out by showing how much real conversation happened. Together they cover effort, reach, conversion and quality without overwhelming anyone.
How do you calculate connect rate and booking rate?
Connect rate is connected calls divided by calls made, so 75 connections from 300 dials is 25%. Booking rate is appointments divided by connected calls, so 6 bookings from 75 connections is 8%. Some teams calculate booking rate against calls made instead, which gives a much smaller number. Either works if you are consistent, but measuring against connected calls separates list quality from conversation quality more clearly.
What is a good connect rate for outbound sales calls?
It depends heavily on the list, the industry and the time of day, so there is no figure worth quoting as a universal benchmark. A fresh list of opted-in enquiries will connect far more often than an aged cold list. The useful comparison is your own team over time on similar lists. If connect rate falls week on week, check list freshness, bad numbers and calling times before looking at the reps.
Which metrics does Veyce report?
Veyce's Reports page shows calls made, connected calls with connect rate, bookings with booking rate, sessions, total talk time, average call length, SMS sent and received, a call outcomes chart and a team leaderboard with connect and booking percentages per rep. The dialler shows live calls made, answer rate, total call time for the session and appointments, and reps log Owner Reached and Pitch Complete with counters during the session.
How often should I review sales call metrics?
Review weekly for decisions about lists, scripts and one-on-ones, because daily numbers swing too much on a single list or a quiet afternoon. Reps benefit from live daily numbers during calling blocks to pace themselves. Monthly and all-time views are useful for spotting longer trends, such as seasonal changes in connect rate, and for checking whether a change you made weeks ago actually held.